.avif)

TL;DR: A healthy ecommerce email program in 2026 hits a 30-40% campaign open rate, a 1.5-3% click rate, roughly 2% conversion on automated sends, and an unsubscribe rate under 0.3%, while driving 25-35% of total store revenue. Flows earn about 18x more revenue per recipient than campaigns. Below benchmark? Fix deliverability first, then opens, then clicks, then conversion.
Ecommerce email marketing benchmarks are the 2026 performance standards that tell Shopify brands whether email is pulling its weight: a 30 to 40% campaign open rate, a 1.5 to 3% click rate, roughly 2% conversion on automated sends, under 0.3% unsubscribes, and 25 to 35% of total store revenue, with flows earning about 18x more revenue per recipient than campaigns.
Here's the problem. The same store can look great against one benchmark report and terrible against another. Klaviyo says the average ecommerce open rate is 37.93%. Brevo says 15.5%. Both are right inside their own panels, and both can mislead you.
This guide gives you the numbers that matter, metric by metric, from the sources worth trusting. Then it goes one step further than the usual benchmark roundup: a diagnostic that tells you exactly what to fix first when a number comes in low. Bookmark the list. Use the diagnostic. That's where the revenue is.
Ecommerce email benchmarks
Here are the core numbers for 2026, pulled from the largest published panels. Klaviyo's 2026 benchmark data is the most relevant panel for Shopify brands because it's built almost entirely on ecommerce senders.
- Campaign open rate: 37.93% (Klaviyo 2026)
- Campaign click rate: 1.69% (Klaviyo 2026)
- Flow click rate: 5.58% (Klaviyo 2026)
- Click-to-open rate (CTOR): about 10.5% (Litmus)
- Automated email conversion: 1.49% (Omnisend 2025)
- Campaign conversion: 0.08% (Omnisend 2025)
- Unsubscribe rate: 0.22% (MailerLite 2025)
- Spam complaint rate: under 0.3%, aim under 0.1% (Google sender guidelines)
- Email ROI: about $36 per $1 spent (Litmus)
Benchmarks also shift by industry. Mailchimp's cross-industry data puts opens between 35 and 45% and clicks between 1.9 and 3.4%, with ecommerce and retail at the low end of both ranges. So compare your store against ecommerce numbers, not blended all-industry averages.
One more anchor before we go metric by metric. Litmus pegs email ROI at roughly $36 returned for every $1 spent. No paid channel comes close, which is why the rest of this guide treats email as a revenue system, not a newsletter.
Good open rate benchmark?
A good campaign open rate for ecommerce in 2026 is 30 to 40%. Klaviyo's panel puts the average at 37.93%. But Apple's Mail Privacy Protection inflates opens by 15 to 20 points, and Apple Mail fires about 58% of all recorded opens. Your true open rate is lower than your dashboard shows.
Open rate is the percentage of delivered emails that get opened. Since Apple started auto-loading tracking pixels, that definition broke. Geysera's analysis shows MPP adds 15 to 20 points of phantom opens, and Apple Mail drives roughly 58% of all opens recorded. A 42% open rate might be a 25% human open rate.
That doesn't make opens useless. It makes them directional. Use them to compare your own subject lines against each other, inside the same account, over the same period. Across the Shopify stores we manage at CartStrings, campaigns average a 39% open rate, and we still treat clicks and revenue as the real scoreboard.
To improve opens, fix the list before the subject line. Send campaigns to engaged segments (opened or clicked in the last 90 days), sunset dead profiles, and raise the quality of new subscribers at the source. A well-built popup and email capture setup feeds your list buyers instead of coupon hunters.
Good click and CTOR rates?
A good ecommerce click rate is 1.5 to 3% on campaigns and 5% or better on flows. Klaviyo's 2026 data shows campaigns averaging 1.69% and flows averaging 5.58%. Click-to-open rate runs near 10.5% per Litmus, and CTOR is the more honest metric in a post-MPP world.
Click rate is clicks divided by delivered emails. CTOR is clicks divided by opens, which tells you whether the people who actually looked at your email found a reason to act. Because MPP pollutes opens, CTOR is noisy too, but the click count itself is clean. Trend your raw click rate first.
The 3.3x gap between flow clicks and campaign clicks isn't a design problem. It's relevance. A cart reminder lands because the shopper just did something. A Tuesday promo lands cold.
To improve clicks, cut your emails down to one job. One offer, one clear call to action above the fold, mobile-first layout, and a subject line that matches the body. If your campaigns click below 1.5% for a full quarter, the calendar and creative need a rework, which is exactly what a dedicated email campaign management service exists to do.
Good conversion rate?
A good conversion rate is about 2% on automated email. Omnisend's 2025 report shows automated emails converting at 1.49% versus just 0.08% for campaigns. Klaviyo's abandoned cart benchmark shows a 3.33% placed-order rate. If clicks are healthy but orders aren't, the problem lives on your site, not in your email.
Conversion rate (Klaviyo calls it placed-order rate) is orders divided by delivered emails. The campaign-versus-automation gap here is the widest in all of email: automated messages convert at nearly 19x the campaign rate because they fire on buying signals.
The ceiling is high. Omnisend found back-in-stock emails convert at 6.72%, the best of any message type, because the shopper already asked for the product.
To improve conversion, work backward from the click. Check that cart links restore the cart, that mobile checkout loads fast, and that your flow logic excludes people who already bought. A flow that keeps emailing converted customers doesn't just waste sends. It buries your placed-order rate.
Unsubs, bounces, spam
Unsubscribe rates doubled in 2025, and that's mostly fine. MailerLite measured the average at 0.22%, up from 0.08% in 2024, after Gmail rolled out one-click unsubscribe. Easier exits mean more exits. Anything under 0.3% per send is normal now, so don't panic over a number that every sender saw rise.
The metric that actually gets you hurt is the spam complaint rate. Google classifies anyone sending 5,000+ emails a day as a bulk sender and requires complaints under 0.3%, with under 0.1% as the real target. Miss it and your mail stops arriving.
The stakes are measurable. Red Sift found compliant senders average 89% inbox placement, while non-compliant senders see 22 to 34% of their mail routed straight to spam. Every metric in this article is zero for an email nobody receives.
Bounce rate rounds out the trio. Hard bounces (dead addresses) tell inbox providers your list is stale. Clean them automatically, use double opt-in where fraud signups are a problem, and never import cold lists. If you suspect placement problems, a deliverability and compliance service can confirm where your mail is actually landing.
Flow benchmarks that pay
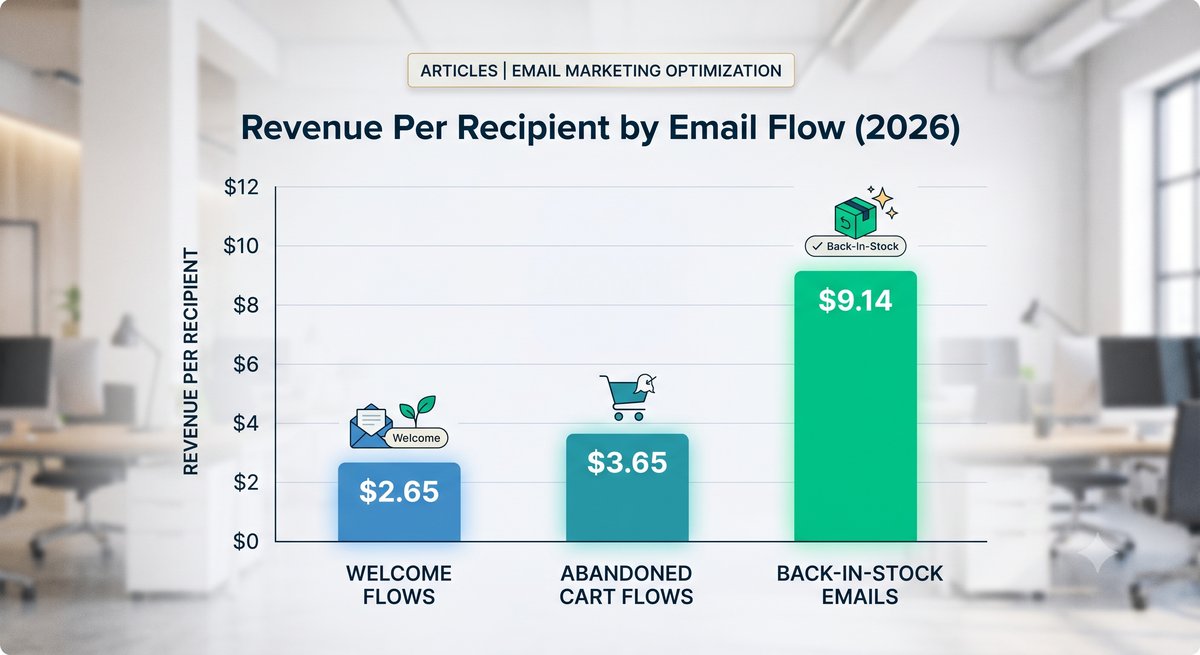
Flows are 5.3% of email volume but roughly 41% of email revenue, per Klaviyo. Per recipient, flows earn about 18x what campaigns earn. Omnisend's research tells the same story from a different panel: automated emails generate $3.41 per email versus $0.155 for campaigns, and 2% of volume drives 37% of email orders.
The per-flow numbers, and the gap between median and elite:
- Abandoned cart: 50.5% open, 6.25% click, 3.33% placed-order, $3.65 revenue per recipient. The top 10% earn $28.89 per recipient, nearly 8x the median.
- Welcome: $2.65 revenue per recipient at the median. Top 10% earn $21.18.
- Back-in-stock: $9.14 per email and 6.72% conversion, the highest of any automation, per Omnisend.
- Browse abandonment: no single published median, but expect it below cart flow performance (weaker intent) and far above any campaign.
Those top-10% gaps are the most useful numbers on this page. An 8x spread between median and elite on the same flow means the upside sits in your own account. Better timing, tighter segmentation, and stronger offers are what a serious Klaviyo email automation service builds toward.
3 numbers that predict sales
Opens and clicks are inputs. Three outputs actually predict revenue: revenue per recipient (RPR), flow share of email revenue (healthy programs sit near 40%), and email's share of total store revenue (target 25 to 35%). CartStrings clients average 32% email-attributed revenue, and every one of them got there by moving these three numbers, not by chasing opens.
Below benchmark? Fix this
Fix low metrics in this order: deliverability and spam rate first, then open rate (list quality), then click rate (offer and design), then conversion (site and flow logic). Each layer sits downstream of the one before it. The best subject line ever written can't save an email that Gmail routed to spam.
Why comparisons lie
The same email program reads 37.93% in Klaviyo's benchmarks, 21.3% in Campaign Monitor's, and 15.5% in Brevo's. Nobody's lying. Each ESP measures its own customers, and those panels differ wildly: Klaviyo skews ecommerce, other platforms mix in transactional and B2B senders, and each handles MPP differently.
So follow two rules. Compare your numbers only against your own ESP's benchmark. And weight your own trailing 90 days more than any industry table, because the only panel that perfectly matches your store is your store.
The fix-it order
Run this diagnostic top to bottom and stop at the first failure:
- 1. Spam complaints above 0.1%, or placement problems? Fix authentication and compliance before touching anything else.
- 2. Opens below 30% on engaged segments? That's a list quality problem. Tighten capture, sunset the unengaged.
- 3. CTOR under 10%? People open and don't act. Fix the offer and the design.
- 4. Clicks fine, orders missing? The email did its job. Fix the landing experience and your flow logic.
Most brands guess at random and fix layer three when layer one is broken. A Klaviyo audit runs this exact diagnostic across your account and shows you which layer is leaking.
Where this leaves you
Benchmarks are a diagnostic tool, not a scoreboard. The 2026 targets worth writing down: 30-40% opens (knowing MPP inflates them), 1.5-3% campaign clicks, about 2% conversion on automations, under 0.3% unsubscribes, and flows carrying roughly 40% of email revenue. Then judge yourself against your own trailing 90 days, because that's the only benchmark with your products, your list, and your margins in it.
If email is driving less than 25% of your store's revenue, one of the four layers is underperforming, and the diagnostic above will find it. If you'd rather have someone who runs this playbook daily take a look, book a call with CartStrings and we'll show you exactly where your account stands.
Frequently Asked Questions
How much revenue from email?
A healthy Shopify brand should see 25 to 35% of total store revenue attributed to email. CartStrings clients average 32%. If you're under 20%, you're leaving money with paid channels that email would return at roughly $36 per $1 spent, per Litmus.
What is a good RPR?
Revenue per recipient is total revenue from a send divided by the number of people who received it. Klaviyo's benchmarks put the median abandoned cart flow at $3.65 RPR, with the top 10% at $28.89, and welcome flows at $2.65 median. Flows overall earn about 18x the RPR of campaigns, which makes RPR the single best measure of email quality.
Are open rates accurate now?
No. Apple's Mail Privacy Protection auto-loads tracking pixels, inflating open rates by 15 to 20 points, and Apple Mail accounts for about 58% of all recorded opens. Use opens to compare your own sends against each other, and rely on clicks, placed orders, and revenue per recipient for real decisions.
How many flows do I need?
A Shopify store doing $500k+ should run at least six: welcome, abandoned cart, abandoned checkout, browse abandonment, post-purchase, and back-in-stock. Klaviyo's data shows flows generate about 41% of email revenue from just 5.3% of send volume, so every missing flow is uncaptured revenue running 24/7.
Good unsubscribe rate?
Keep it under 0.3% per send. MailerLite measured the 2025 average at 0.22%, double the 2024 figure of 0.08%, after Gmail's one-click unsubscribe rollout. A rising unsub rate mostly reflects easier exits, so watch your spam complaint rate more closely; that's the number Google actually punishes.