.avif)

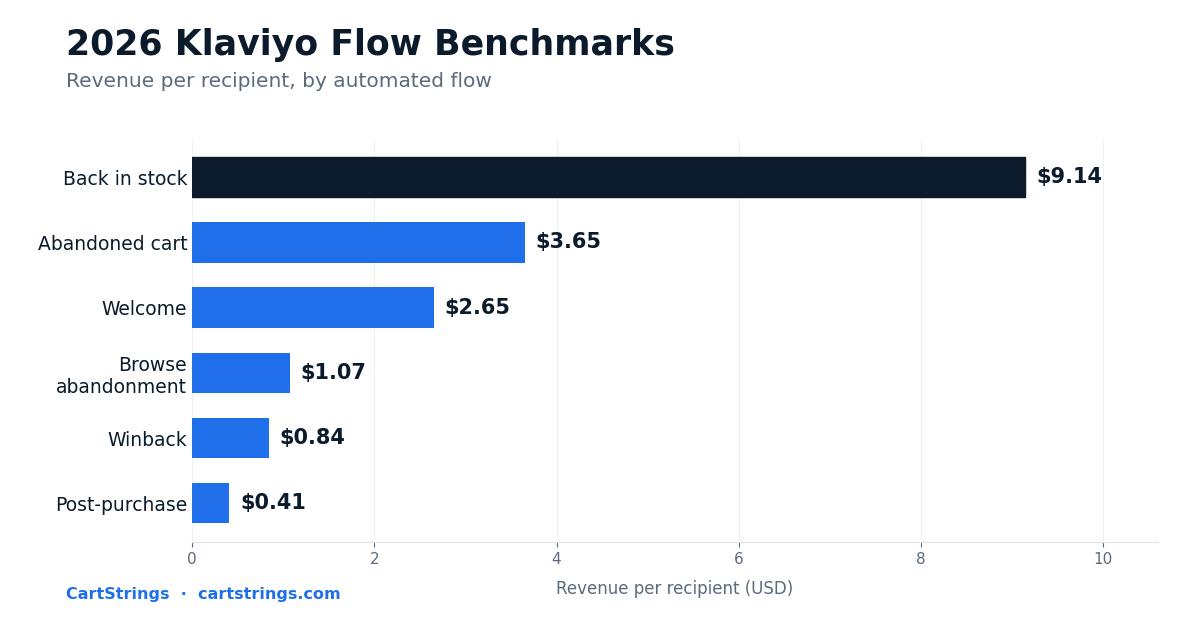
TL;DR: In 2026, Klaviyo flows average a 48.6% open rate and a 5.58% click rate. Abandoned cart flows place orders at 3.33% and earn $3.65 per recipient, while back-in-stock leads every flow at $9.14. Flows should drive 30-40% of your email revenue from just 2-5% of your sends. Treat opens as directional (Apple MPP inflates them 15-35%) and grade flows on placed-order rate and RPR instead.
Based on 2026 Klaviyo platform data, a healthy Klaviyo flow is an automated email that averages a 48.6% open rate, a 5.6% click rate, and $0.41 to $3.65 in revenue per recipient for Shopify brands, with abandoned cart flows converting at a 3.33% placed-order rate. Those are the Klaviyo flow benchmarks that matter this year, and most operators grade themselves against the wrong ones.
Here's the problem. A blended average hides more than it reveals. Your list source, your AOV, your discount depth, and your share of Apple Mail subscribers all change what "good" means for your store. A brand capturing emails through a product quiz should not expect the same click rate as a brand running a generic 10%-off popup.
This guide gives you the 2026 numbers flow by flow, shows you how flows stack up against campaigns, and then does the part most benchmark posts skip: it helps you adjust the numbers to your own store and diagnose exactly which lever is broken when you fall short.
Klaviyo flow benchmarks 2026
Here are the per-flow numbers to grade yourself against, drawn from Klaviyo's email marketing benchmarks and cross-checked against industry data. Where Klaviyo doesn't publish a flow-specific figure, use the all-flow average (48.6% open, 5.58% click) as your directional baseline.
- Back in stock: 59.19% open, ~5.6% click (flow avg), 5.34% placed-order rate, $9.14 RPR
- Abandoned cart: 50.5% open, 6.25% click, 3.33% placed-order rate, $3.65 RPR
- Abandoned checkout: ~50% open, ~6% click (tracks cart), 3.3%+ placed-order (higher intent), $3.65+ RPR
- Welcome: ~48.6% open, ~5.6% click (flow avg), 58.26% click-to-conversion, $2.65 RPR
- Browse abandonment: ~48.6% open, ~5.6% click (flow avg), placed-order below cart, $1.07 RPR
- Winback: ~48.6% open, ~5.6% click (flow avg), placed-order below cart, $0.84 RPR (for $100-200 AOV brands)
- Post-purchase: ~48.6% open, ~5.6% click (flow avg), lowest placed-order of the seven, $0.41 RPR
Two notes on reading these numbers. First, welcome flow RPR varies widely by source: Klaviyo's data puts it at $2.65, while Omnisend's data pegs welcome emails at $6.16 apiece. The gap comes from list quality and offer strength, not measurement error. Second, RPR (revenue per recipient) is the money metric. It rolls open, click, and conversion into one number you can multiply against flow volume.
Do flows beat campaigns?
Yes, decisively. Klaviyo's platform data shows flows click at 5.58% versus 1.69% for campaigns, and they convert at roughly a 13x higher placed-order rate. Automations make up only 2-5% of email volume yet drive 37-41% of email-attributed sales. Your target: flows generating 30-40% of total email revenue.
That does not make campaigns optional. Campaigns still produce the other 60-70% of email revenue and feed your flows with engagement data. The point is efficiency. Every flow email works harder than every campaign email because it fires off real behavior: a cart, a browse, a first purchase.
If your flows sit below 20% of email revenue, you have missing or underbuilt automations. If they sit above 50%, your campaign program is probably undersent, not your flows overperforming. Both are fixable, but they're different problems.
Klaviyo flow benchmark tiers
Averages describe the middle of the pack. You should aim higher. The average flow opens at 48.6%, but top performers hit 65.7%. The average abandoned cart flow places orders at 3.33%, but the top 10% hit 7.69%, more than double the median.
Think in three bands rather than a single pass-fail line:
- Below average: cart placed-order under 3.3%, flow open under 48%, flow revenue share under 20%. Something structural is broken.
- Average: you match the numbers above. Fine, but you're leaving the gap to the top decile on the table.
- Top 10%: cart placed-order near 7.69%, opens above 65%. This is where a $2M store finds another $100k-200k a year without new traffic.
Industry matters too. Jewelry and apparel carry different browse behavior than supplements or CPG replenishment brands. A high-AOV, long-consideration product will show lower placed-order rates and higher RPR than a $30 impulse buy. Compare yourself to your vertical inside Klaviyo before you panic about a global number.
Are open rates reliable?
No, not on their own. Apple Mail Privacy Protection auto-fires open pixels and inflates open rates by 15-35%. With Apple Mail accounting for roughly 58% of all opens, a 55% flow open rate might reflect a real rate closer to 40%. Treat opens as directional and grade flows on click rate, placed-order rate, and RPR.
Quick definitions so you're measuring the same thing Klaviyo is. Click rate is unique clicks divided by delivered emails. Placed-order rate is orders attributed to the message divided by delivered. RPR is attributed revenue divided by delivered recipients. All three survive MPP because they measure action, not pixel loads.
There's a second reason 2026 benchmarks look different from 2023 posts: the Gmail and Yahoo sender requirements. Since June 2024, senders above a 0.3% spam-complaint rate lose mitigation eligibility entirely. Industry surveys found about 23% of senders hit deliverability problems and 49.5% changed their programs in response. SPF, DKIM, and DMARC are now table stakes per Google's email sender guidelines. If your flow opens dropped and clicks dropped with them, suspect deliverability before creative.
Adjust flow benchmarks to you
This is the section most benchmark articles skip. A single blended average will mislead you, because the right target for your store depends on inputs you control. Here's how to adjust.
Adjust for your list source
A list built from a quiz or zero-party capture flow will out-open and out-click a list built from a generic discount popup, often by a wide margin, because subscribers told you what they want. Only about 16% of marketers actively build zero-party data into their plans, which makes it a genuine edge. If your popup and capture setup is a plain 10%-off form, benchmark yourself against the averages. If you run quiz-based capture, hold yourself to top-quartile numbers.
Your Apple share matters the same way. Pull the share of your list on Apple Mail. If it's above the ~58% norm, discount your open rates harder and lean almost entirely on clicks and RPR.
The diagnosis decision tree
When a flow underperforms, check metrics in this order. Each gap points to a different fix.
- Delivery and spam complaints off? Complaints near 0.3% or delivery under 99%: it's a deliverability problem. Fix authentication and sending behavior first. Nothing downstream matters until this is clean.
- Delivery fine, clicks under ~5.6%? It's a creative problem. Subject lines, email design, and message-to-moment fit need work.
- Clicks fine, placed-order below benchmark? It's an offer or landing problem. The email did its job; the incentive, price point, or product page did not.
- Placed-order fine, RPR low? It's a traffic-quality or economics problem. You're converting cheap carts, discounting too deep, or attracting low-AOV buyers.
When to get an audit
Use a concrete threshold. If two or more core flows sit below the median on both click and placed-order rate for 60+ days, or your flow revenue share sits under 20% of email revenue, the fix is structural, not a subject-line tweak. That's the point where a Klaviyo audit pays for itself, because it locates which of the four gaps above is actually bleeding revenue. Across the Shopify stores we manage at CartStrings, accounts arriving below those thresholds typically climb to 32% email-attributed revenue once the broken layer is fixed.
Where is the Benchmarks tab?
Inside Klaviyo, go to Analytics and open the Benchmarks tab. It compares your account against similar businesses on the metrics that matter, and it treats placed-order rate and RPR as the key flow metrics, exactly as this article does. Check it quarterly, not daily.
One trap when comparing numbers there: cart abandonment and checkout abandonment are distinct triggers. Added to Cart fires earlier and catches more people at lower intent. Checkout Started fires later and converts higher. If you benchmark a cart-triggered flow against checkout-abandonment numbers, you will falsely conclude you're underperforming. Match trigger to benchmark before you judge.
How do I lift each flow?
Start with structure, not copy. Three-email abandoned sequences recover roughly 6.5x more revenue than single-email flows, and a healthy cart recovery program lands 5-11% of abandoned checkouts, worth 3-8% of total store revenue. If any core flow is one email long, lengthening it is your highest-ROI move this quarter.
Flow-specific plays:
- Abandoned cart/checkout: run both triggers separately, three-plus emails each, with the discount held back until email two or three.
- Welcome: the click-to-conversion rate is 58.26%, so everything before the click is the bottleneck. Test subject lines and hero offers hard.
- Back in stock: at 59.19% opens and $9.14 RPR, coverage is the lever. Add the trigger to every restocking product.
- Post-purchase and winback: low RPR is normal; these flows earn on retention. Use them to collect zero-party data that sharpens everything else.
- All flows: users of Klaviyo AI's personalized send time report roughly 25% RPR lifts, one of the cheapest wins available.
Building or rebuilding these is exactly what our email automations service does for brands every month.
The bottom line
The 2026 Klaviyo flow benchmarks give you a floor, not a finish line: 48.6% opens, 5.58% clicks, 3.33% cart placed-order rate, and 30-40% of email revenue from flows. Grade yourself on placed-order rate and RPR, adjust for your list source and Apple share, and use the decision tree to find which layer (deliverability, creative, offer, or traffic) is holding you back. If two flows have trailed the median for 60+ days, stop tweaking and get a structural review. At CartStrings, we run these diagnostics on Shopify brands doing $1M+ a year, and the pattern is consistent: the gap between average and top 10% is usually three fixes away. Book a call and we'll show you where your flows stand.
Frequently Asked Questions
Good open rate for flows?
A good Klaviyo flow open rate in 2026 is 48.6%, the platform average, with top performers reaching 65.7%. Abandoned cart flows average 50.5% and back-in-stock flows lead at 59.19%. Remember that Apple MPP inflates all of these figures, so pair open rate with click rate before drawing conclusions.
Good revenue per recipient?
It depends entirely on the flow. Klaviyo's benchmark data puts back-in-stock at roughly $9.14 per recipient, abandoned cart at $3.65, welcome at $2.65, browse abandonment at $1.07, winback at $0.84 for $100-200 AOV brands, and post-purchase at $0.41. Judge each flow against its own number, not a blended average.
How much revenue from flows?
Flows should generate 30-40% of your total email revenue. Klaviyo platform data shows automations make up just 2-5% of email volume while driving 37-41% of email-attributed sales. If flows produce under 20% of your email revenue, you have missing or underbuilt automations worth fixing first.
Good cart recovery rate?
A healthy abandoned cart program recovers 5-11% of abandoned checkouts, which typically equals 3-8% of total store revenue. On a per-email basis, the average cart flow places orders at 3.33% while the top 10% hit 7.69%. Three-email sequences recover about 6.5x more revenue than single-email flows.
Are opens accurate with MPP?
No. Apple Mail Privacy Protection preloads tracking pixels and inflates open rates by 15-35%, and Apple Mail accounts for roughly 58% of all opens. Treat open rate as a directional signal only. Grade your flows on click rate, placed-order rate, and revenue per recipient, since those measure real subscriber actions.